SQL Analysis - eBay Store
Using Microsoft SQL Server, downloaded csv files from a small eBay store (mine :) based in Houston, TX and sells mostly vintage items), and uploaded the reports into SQL Server.
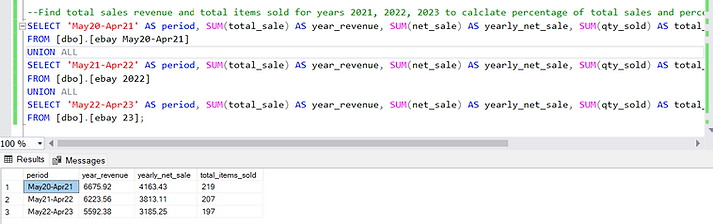
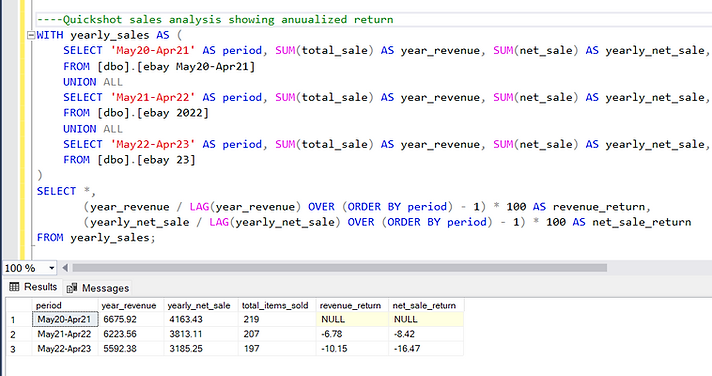
What's the big picture? I wanted to see total sales and utilized the UNION function to bring 3 years of sales together.
Year 1 was the best selling period.
I then modified the above code by using a CTE (Common Table Expression) and added two columns where I used the 'LAG( )' function to calculate the annualized returns for revenue and net sales as a year-to-year comparison.
That's a 25% loss in Net Sales over a two year span. Oof!!!
Over that 2 year time span, individual sales decreased by 10.3%
The items selling were not as profitable either.
Why the decrease in sales?
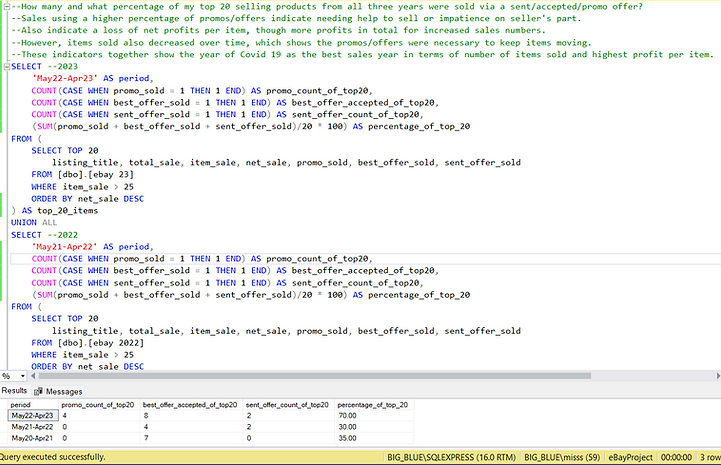
Not only did the orders received decrease, but more promotional tools were used to get those fewer sales that also were not as profitable. There is no one reason for the decrease in sales, it is a combination of covid shoppers spending an inccreased amount and also a general decrease in orders.
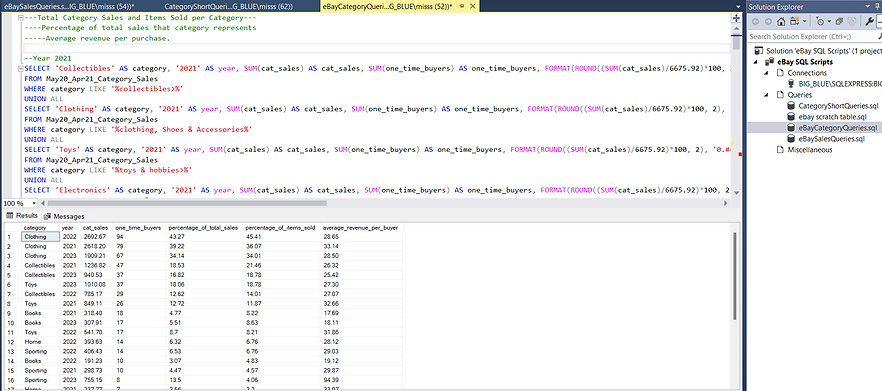
Which categories (and which years) brought in the most orders and revenue?
Using wildcards, multiple calculations, and the LIKE function to categorize the listings, and sorted by number of orders, I create a list wherein clothing was the top seller all three years in terms of orders and percentage of revenue. I also have the average revenue brought in per item bought in each category.
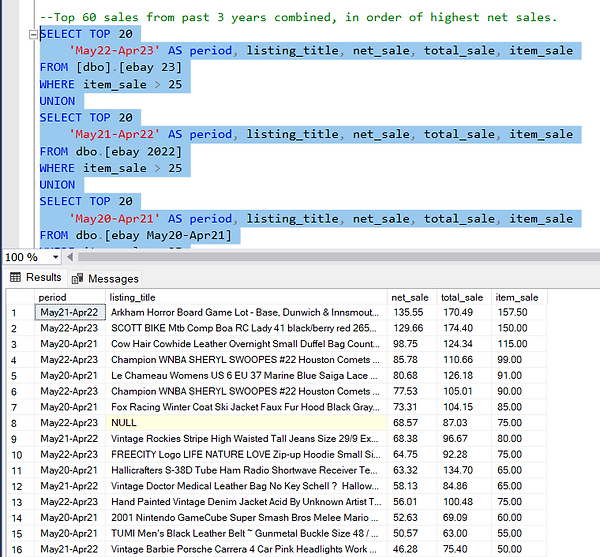
What are the top sales overall?
Improvements/Questions for further analysis:
-Find/request data from eBay that shows the length of the listings, how long they took to sell.
-How much the items were originally purchased for to determine true COGS.
-Amount of time to list items, to determine if the time needed to list (clean, photograph, research, weigh, create listing, ease of packaging) negates the profit to be made.
-Amount of space that items take up, in order to determine if more compact items are more practical in terms of storage space and cost to ship, not to mention that larger items typically sell much slower due to customer not wanting to pay higher shipping fees.
-What the items were listed for vs. what they actually sold for (offers sent/received).
-What's going on with the active listings?
I have created a table, where I will be inputting averages for several of the above questions. It is not complete, but the start of it is shown below.
Please see the Tableau dashboard for some visualizations of this analysis. They are not exact, as the files were uploaded separately to Tableau and categorized slightly differently. Another step in this process for me is uploading my SQL script into Tableau, so the visualizations are more reminiscent of my SQL analysis.
.png)
.png)