
Grumpy Goat Bicycles
A business analysis and a dashboard was the original intent for this small bikeshop, but with the owner's intent to secure a small business loan and move to a larger and more prominent location, it became obvious that a financial revamp was needed first. Some key points from my work with this company:
-
Identified and resolved accounting discrepancies, boosting profit margins by correcting inventory pricing.
-
Prepared financial accounting sheets (Income Statement, Balance Sheet, Profit & Loss Statement) and a 3 year growth projection. Calculated YOY Sales growth, profit margin, and parts margin figures.
-
Identified cost-saving opportunities within the shop’s financial operations. Recommended fee-free small business accounts, eliminating unnecessary interest debt payments and multiple monthly account fees.
-
Regularly communicated data insights and recommendations to clients, facilitating understanding through clear presentations and in-depth explanations, while addressing any inquiries.

The Google Sheets Dashboard
At the top of the dashboard is a small ribbon with the YOY Sales Growth and Profit Margins for the most recent quarter.
Below the ribbon, 2 bar charts showing the number of repairs completed per month for the last 12 months and revenue generated from those repairs.
Next a pie chart showing half the revenue comes from parts, and specifically wheelsets and accessories alone (donut graph) account for half of the parts revenue. This shop specializes in custom bike builds, and is also e-bike certified.
The horizontal side-by-side bar chart drills down into which bike part category sells the most and also brings in the most revenue as an average per item sold.
The line graphs at the bottom of the dashboard are illustrate that the bike shop broke even (trend lines as month to month revenue varies) in less than a year, and that 2023 is looking great thus far.
Google Sheets - Reports
For ease of sharing key information with the credit union (for the small business loan application) and interacting with the owner, portions of the data were copied over to Google Sheets, where an analysis of overall trends, performance, and financial reports were further analyzed.
.png)
.png)
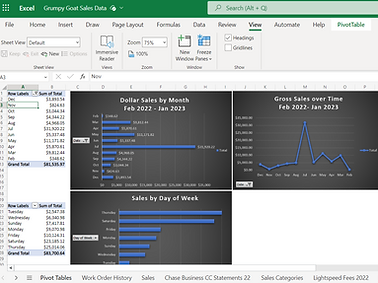
Excel - Initial Data Cleaning and Analysis
Initial data cleaning and analysis was completed in Excel. The spreadsheets here are more technical and specific, rather than a quickshot of performance. This is the stage where the accounting discrepancies and inefficient money use were identified, and recommendations were then made for collecting payments in one system (owner was also using Venmo)
Improvements
Automate! This is the next step for this bike shop. Using an API to connect to the spreadsheet software of the owner's choosing. The owner is not satisfied with the sales software (Lightspeed HQ R-Series) being used and indeed, it provided only basic reports with no context and synchronicity between portions of the site regarding inventory costs and retail prices was inconsistent.
There are recommendations for the bike shop specifically which are being addressed. To address low season revenue, the shop is expanding rentals from e-bikes and guided excursions, to a fleet of mountain bikes and paddleboard rentals. Take a look at their Instagram! instagram.com/grumpygoatgear/
.png)